

GARRETT G-SMART MODULE
The new Garrett G-Smart Module allows you to track your turbo’s performance in real-time, transmitting turbo speed and boost via Bluetooth with the free G-Smart application

This important data will allow users to see if they are operating the turbocharger within its recommended RPM limits to optimise durability and performance.
Garrett Motion says the Garrett G-Smart Module is your turbocharger’s ultimate companion, guiding you towards unparalleled performance.
Easy to install and setup
Say goodbye to tangled wires and tedious setups – bluetooth functionality means no wires through the firewall for a quick and easy installation.
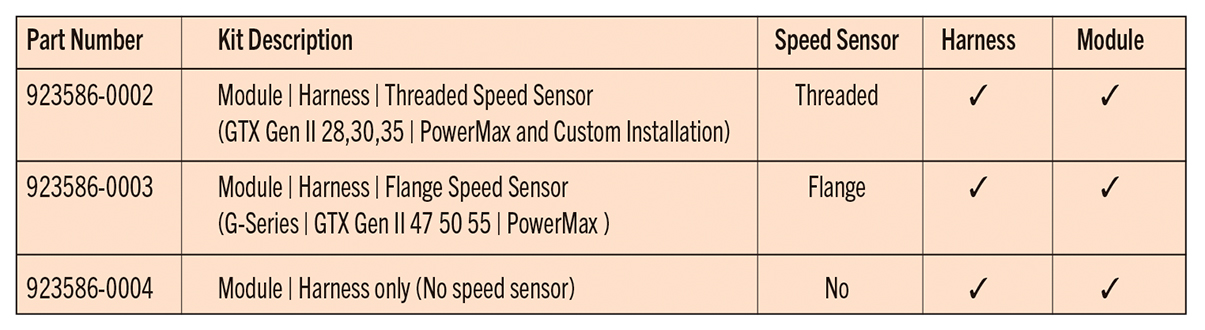
The plug-and-play harness accepts Garrett flange and threaded style speed sensors. Kits are available without a speed sensor for users who already have a speed sensor and with for those who don’t have one.
A 12V switched power and sufficient ground connection are all you need to get started.
The Sensor Setup menu is loaded with existing Garrett Turbocharger part numbers, models, compressor wheel blade counts and max-rated turbo speed.
Custom configurations can also be created for Garrett models without speed sensor ports or for non-Garrett manufactured turbochargers that utilise the same style speed sensors. For use with iOS and Android mobile devices. (Mobile device and mount not included).
Analyse Turbo Speed and Boost Pressure
With the device paired and the car running, the mobile device screen will light up with live turbo speed and boost pressure (if connected) in a dynamic gauge and graphical format.
The gauge display features a constant live data feed and has a marker that freezes on peak turbo speed.
The graph plot length can display up to 120 seconds of live data. The live data feed can be paused allowing users to review data points within the plot length with a touch of the screen. Users can connect the analog output to an external data logger/ECU for complete data logging.
An important warning
Garrett Motion warns that the use of any turbocharger product above maximum turbocharger speed is at the owner’s risk and can result in damage and premature failure.
To protect the turbocharger from overspeed when operating, a speed sensor can be installed into the compressor housing to monitor shaft speed.
This important data will allow users to see if they are operating the turbocharger within its recommended RPM limits to optimise durability and performance.
Garrett Motion says the Garrett G-Smart Module is your turbocharger’s ultimate companion, guiding you towards unparalleled performance.
Key features and benefits:
Standout features of the Garrett G-Smart Module include:
• Bluetooth operation transmits data from the module to the G-Smart application
• Modern display with live turbo speed and boost pressure (if connected) readings
• Gauge sweep will transition colour (G,Y,R) signalling the approach to max-rated turbo speed
• Marker on gauge sweep indicates peak turbo speed
• Display up to 120 seconds of turbo speed and boost data in easy-to-view graphical format
• Compatibility with both Android and iOS devices
• Easy installation and configuration with pre-set Garrett models and part numbers
• Create custom configurations for Garrett turbochargers without pre-machined speed sensor port or non-Garrett manufactured turbochargers
• Min/Max Turbo speed and boost pressure stored in app for future analysis
Why is knowing turbo speed important when tuning a vehicle
When tuning a car with a turbocharged engine, knowing the turbo’s speed is crucial for optimising performance and ensuring reliability.
The turbo’s speed directly impacts airflow and boost pressure, which are critical factors in engine power.
Running a turbo at excessive speeds can lead to mechanical failure, increased temperatures, and reduced lifespan, while insufficient speed can result in poor performance and lag.
Monitoring turbo speed allows tuners to adjust boost levels, fuel, and timing settings to match the engine’s needs, providing optimal efficiency and preventing damage. This data ensures the engine runs safely within its designed limits.
So next time you tune a vehicle, Garrett says a few critical turbo related measurements you should be recording is boost pressure, back pressure, Turbo speed and manifold intake temperatures.
Only then will you know the full picture of where you are in relation to the most efficient range of that turbocharger and then to be able to chart this range on a compressor map provided by Garrett Advancing Motion against each model variation.
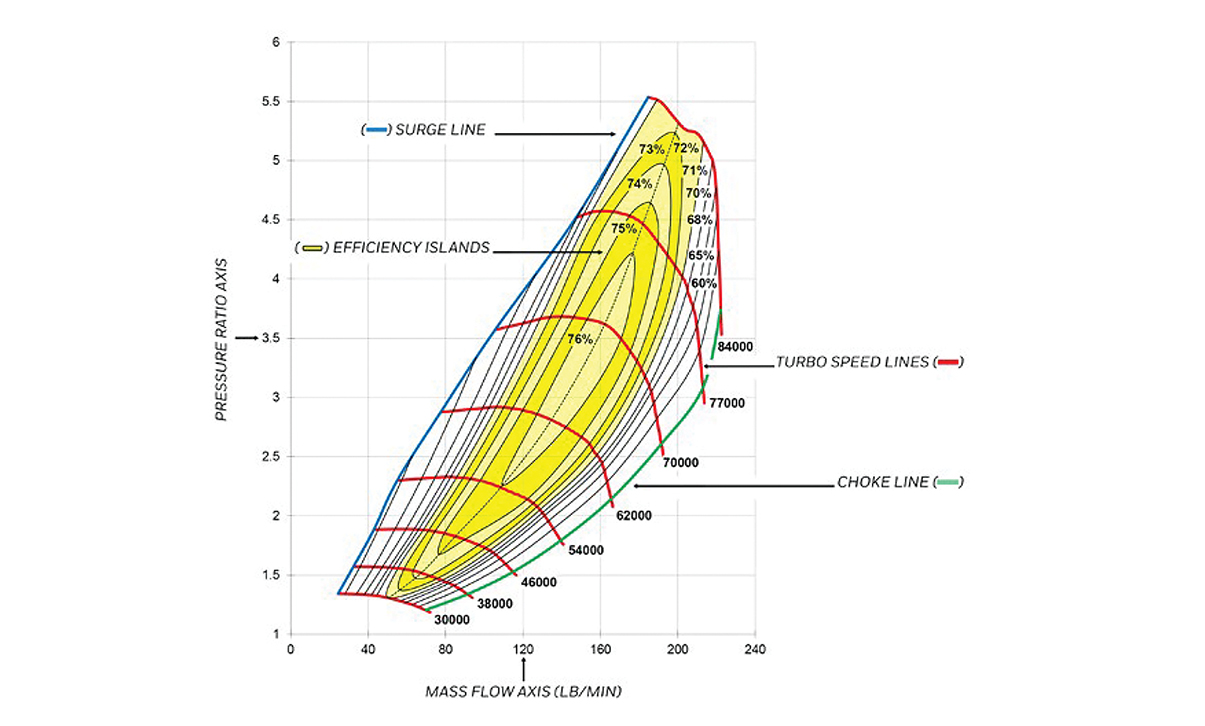
How to read a compressor map
The compressor map describes each compressor’s performance characteristics, including efficiency, mass flow rate, turbo speed, choke line, surge line, and pressure ratio:
• Efficiency Islands: Efficiency Islands are concentric regions that represent the compressor efficiency at any point on the map. The smallest island near the center of the map is the highest or peak efficiency island. As the rings move out from there, the efficiency drops by the indicated amount until the surge and choke limits are reached.
• Mass Flow Rate: Mass Flow Rate is the mass of air flowing through a compressor over period of time and is expressed as lb/min. As a very general rule, turbocharged gasoline engines generate 10.0-11.0* horsepower at the flywheel for each lb/min of airflow. So, an engine with a target peak horsepower of 400 Hp will require 36-40 lb/min of airflow to achieve that target. Many people use Volumetric Flow Rate (expressed in cubic feet per minute, CFM or ft3/min)) instead of mass flow rate. Volumetric flow rate can be converted to mass flow by multiplying by the air density. Air density at sea level is 0.076lb/ft3. Mass flow can be physically measured, but in many cases it is sufficient to estimate the mass flow when choosing the proper turbo.
• Turbo Speed: Turbo Speed Lines are constant turbo speed measured in RPM. As turbo speed increases, the pressure ratio and mass flow increases. Turbo speed lines are very close together at the far right edge of the map indicating a potential turbo over-speed condition.
• Choke Line: The Choke Line is the right-hand boundary of the compressor map and defined at the point where the efficiency drops below 58 percent. In addition to the rapid drop of compressor efficiency past this point, turbo speed also approaches or exceeds the recommended limit. If your actual or predicted operation is beyond this limit, a larger compressor is necessary.
• Surge Line: Surge is the left-hand boundary of the compressor map and represents a region of flow instability. This region is characterized by mild flutter to wildly fluctuating boost from the compressor. Continued operation within this region can lead to premature turbo failure due to heavy thrust loading. Surge will decay once the turbo speed finally slows enough to reduce the boost and move the operating point back into the stable region. This situation is commonly addressed by using a Blow-Off Valve (BOV) or bypass valve. A BOV functions to vent intake pressure to atmosphere so that the mass flow ramps down smoothly, keeping the compressor out of surge. In the case of a recirculating bypass valve, the airflow is recirculated back to the compressor inlet.
Measurements to be calculated include:
• Pressure Ratio: where: Nc = Pressure Ratio, P2c= Absolute Outlet Pressure, and P1c= Absolute Inlet Pressure.
• Absolute Pressure: it is important to use units of Absolute Pressure for both P2c and P1c. Absolute Pressure at sea level is 14.7 PSIa. In units of PSIa, the “a” refers to “absolute”. This is referred to as standard atmospheric pressure at standard conditions.
• Gauge Pressure: measures the pressure above atmospheric, so a gauge pressure reading at atmospheric conditions will read zero. Boost gauges measure the manifold pressure relative to atmospheric pressure, and thus are measuring Gauge Pressure. In units of PSIg, the “g” refers to “gauge”. This is important when determining P2c.
• Calculating P2c: for example, a reading of 12 PSIg on a boost gauge means that the air pressure in the manifold is 12 PSI above atmospheric pressure. For standard atmospheric conditions, 12 PSIg + 14.7 PSIa = 26.7 PSI absolute compressor outlet pressure (P2c). The pressure ratio at this condition can now be calculated: 26.7 / 14.7 = 1.82.
• Depression: a pressure loss upstream of the compressor caused by any restriction from the air filter or restrictive ducting. Depression can be 1 PSIg or more on some intake systems. In determining pressure ratio, the absolute pressure at the compressor inlet (P1c) is often LESS than the ambient pressure, especially at high load. Taking into account the 1 psig intake depression, the pressure ratio is now: (12 psig + 14.7 PSIa) / 13.7 PSIa = 1.95.
• Elevation: higher elevations can have a significant effect on pressure ratio. Turbo speed increases to compensate for increases in altitude. Substitute the actual atmospheric pressure in place of the 14.7 psi in the equations above to give a more accurate calculation. For example, at Denver’s 5000 feet elevation, the atmospheric pressure is typically around 12.4 psia. In this case, the pressure ratio calculation, taking into account the intake depression, is: (12 psig + 12.4 psia) / (12.4 psia – 1 psig) = 2.14 Compared to the 1.82 pressure ratio calculated originally, this is a big difference.
• Estimated Horsepower: performance results of this product are highly dependent upon your vehicle’s modifications and tuning/ calibration. The horsepower numbers represented above are calculated based strictly on choke flow of the compressor map (total turbo capability), which represents the potential flywheel horsepower.
For more information, visit www.garrettmotion.com